Leading the way
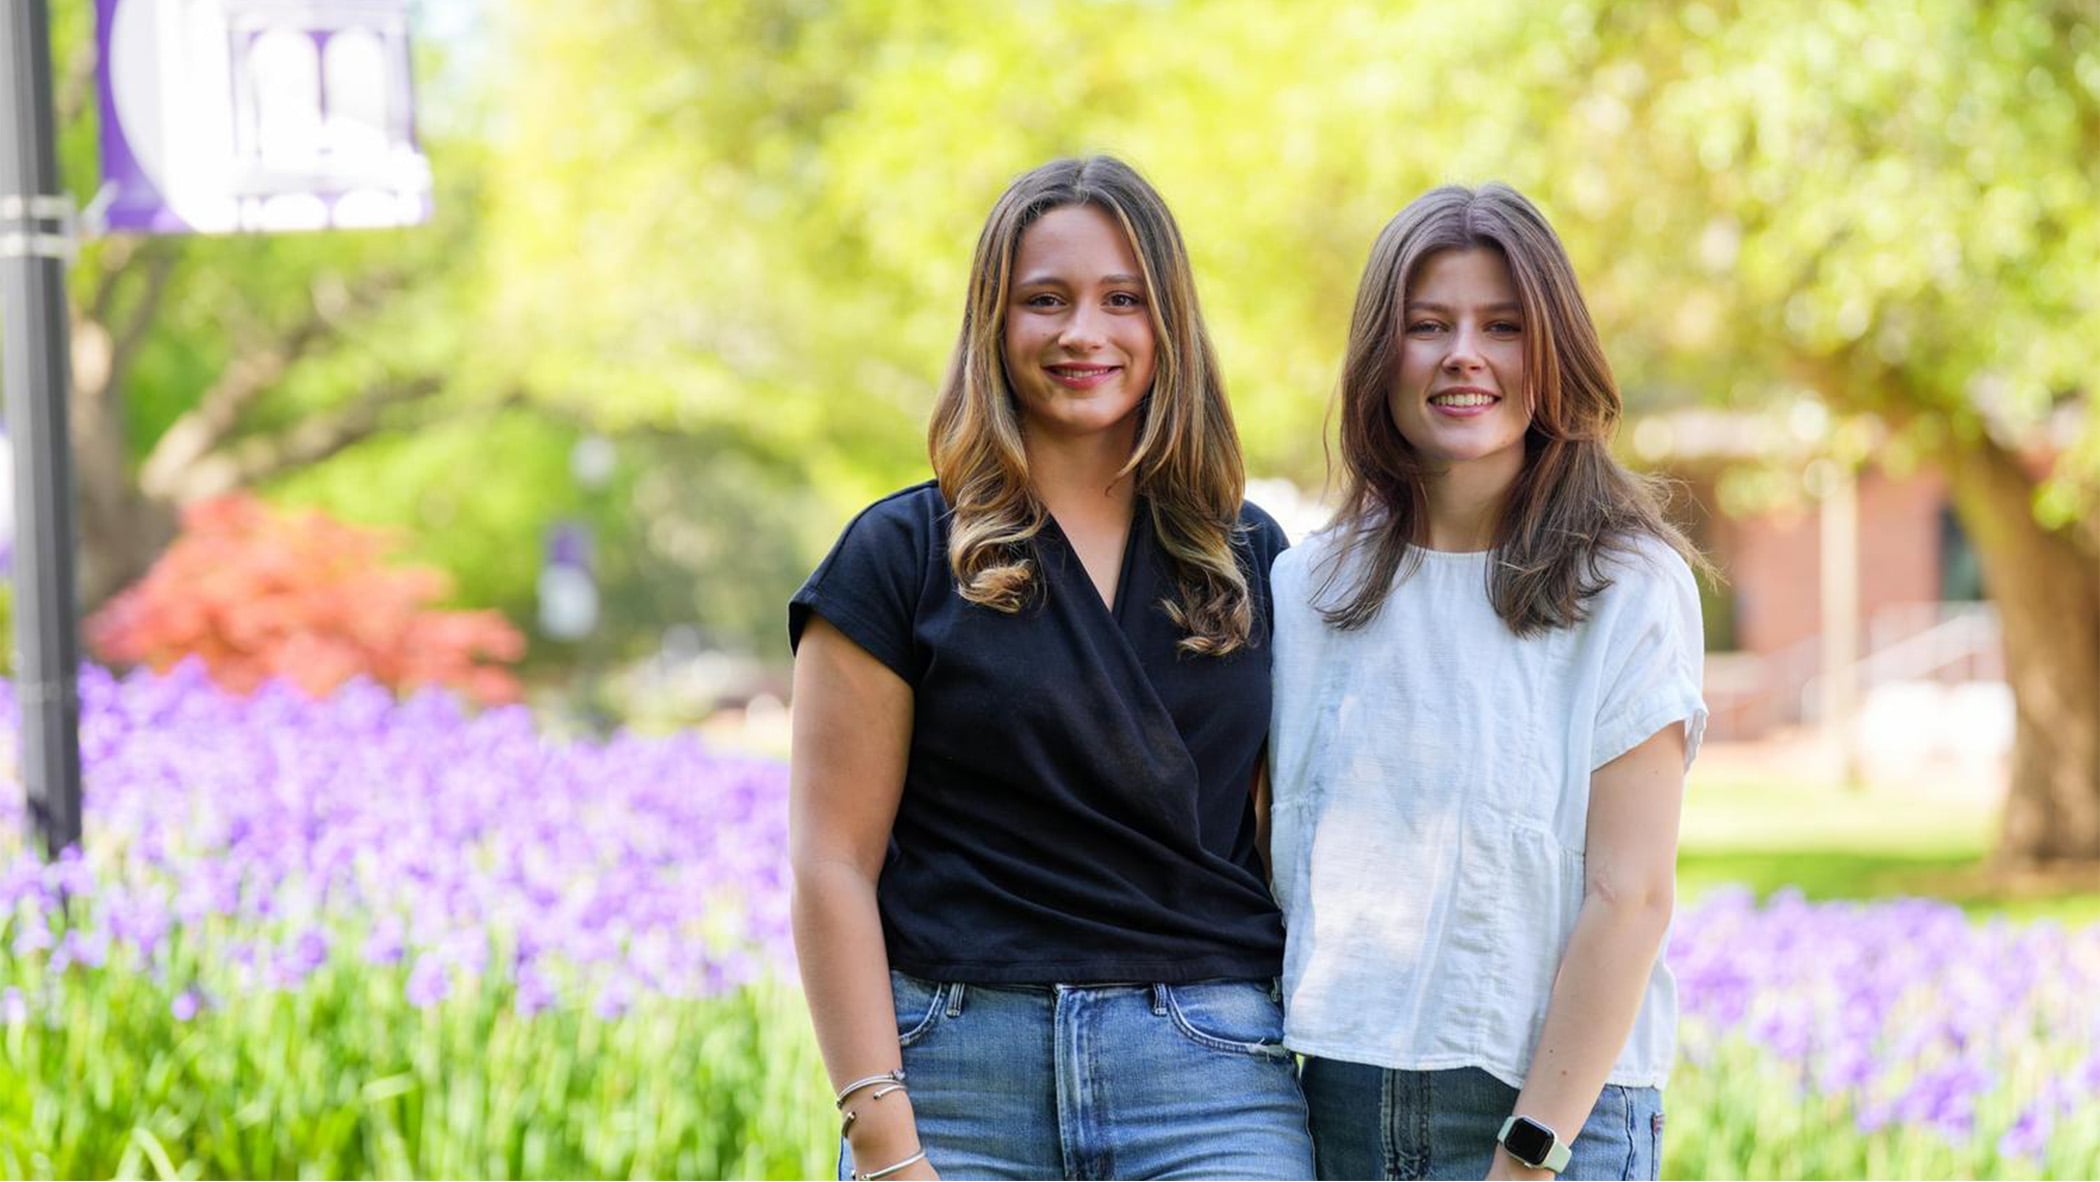
It’s easy to see the small classroom size, the close-knit community of students, faculty and staff, or the expansive curriculum at Furman as its main advantage to any other school in the country. These are just a few of the reasons students and faculty choose Furman over the dozens of others they might have considered. But in true Furman fashion, we don’t stop there. We have a true difference-maker: The Furman Advantage. Being exceptional is our standard.
The Furman Advantage develops students through engaged, interactive learning, starting with their first class and only symbolically concluding when they don their cap and gown and take that commencement walk. They take what and how they learn well into their futures. It’s a commitment to helping each student learn what they love in the classroom and their chosen field by networking, understanding, experiencing and doing.
And we know this approach works and is attractive to prospective students and families, because we are seeing double-digit growth in applications year-over-year,
Standing out
-

Furman sees double-digit growth in applications
Dogged work by enrollment management staff and strategic communications to applicants helped increase applications from across the country and overseas. -

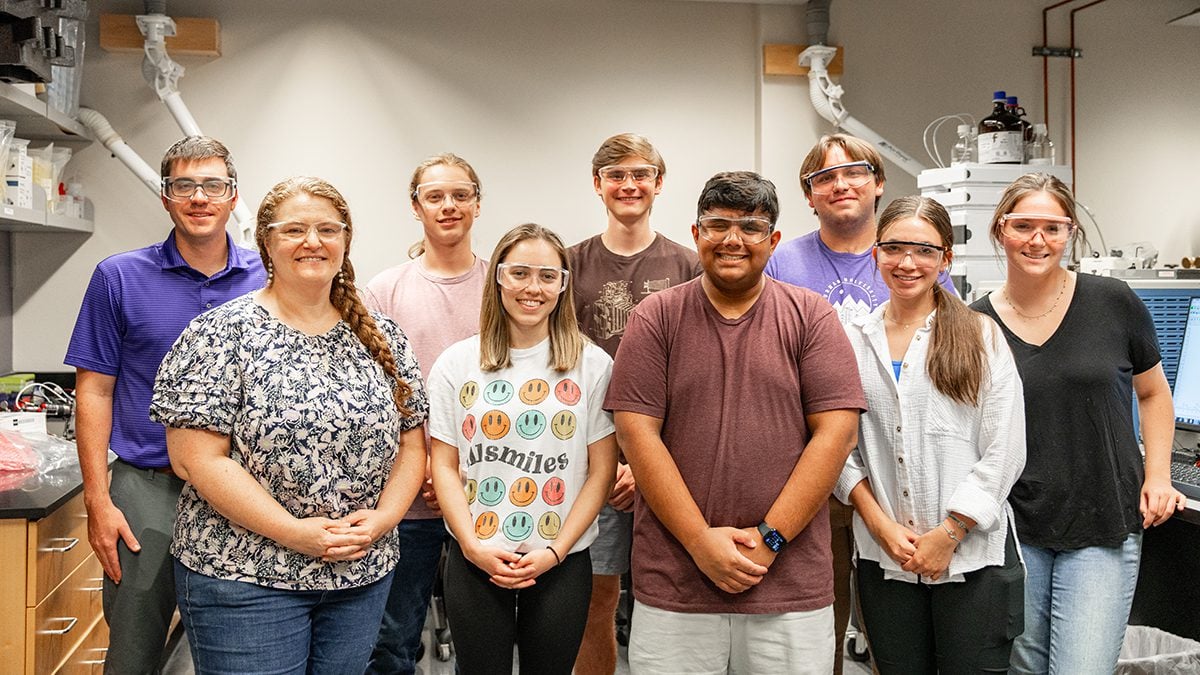
Major accomplishments in fields of study
Stapleton earns prestigious award in chemistry from Iota Sigma Pi. She heads west to the University of Arizona College of Medicine-Tucson where she’ll dive into the Medical Scientist Training Program funded by NIH. -
And national and international accolades
“I want to take inspiration from my work with Dr. Wagenknecht and follow research that aims to develop novel ways of sourcing and storing energy. I want to conduct research for protecting our planet and preserving it for future generations.” — Tilly Barker ’25
Your Path Forward
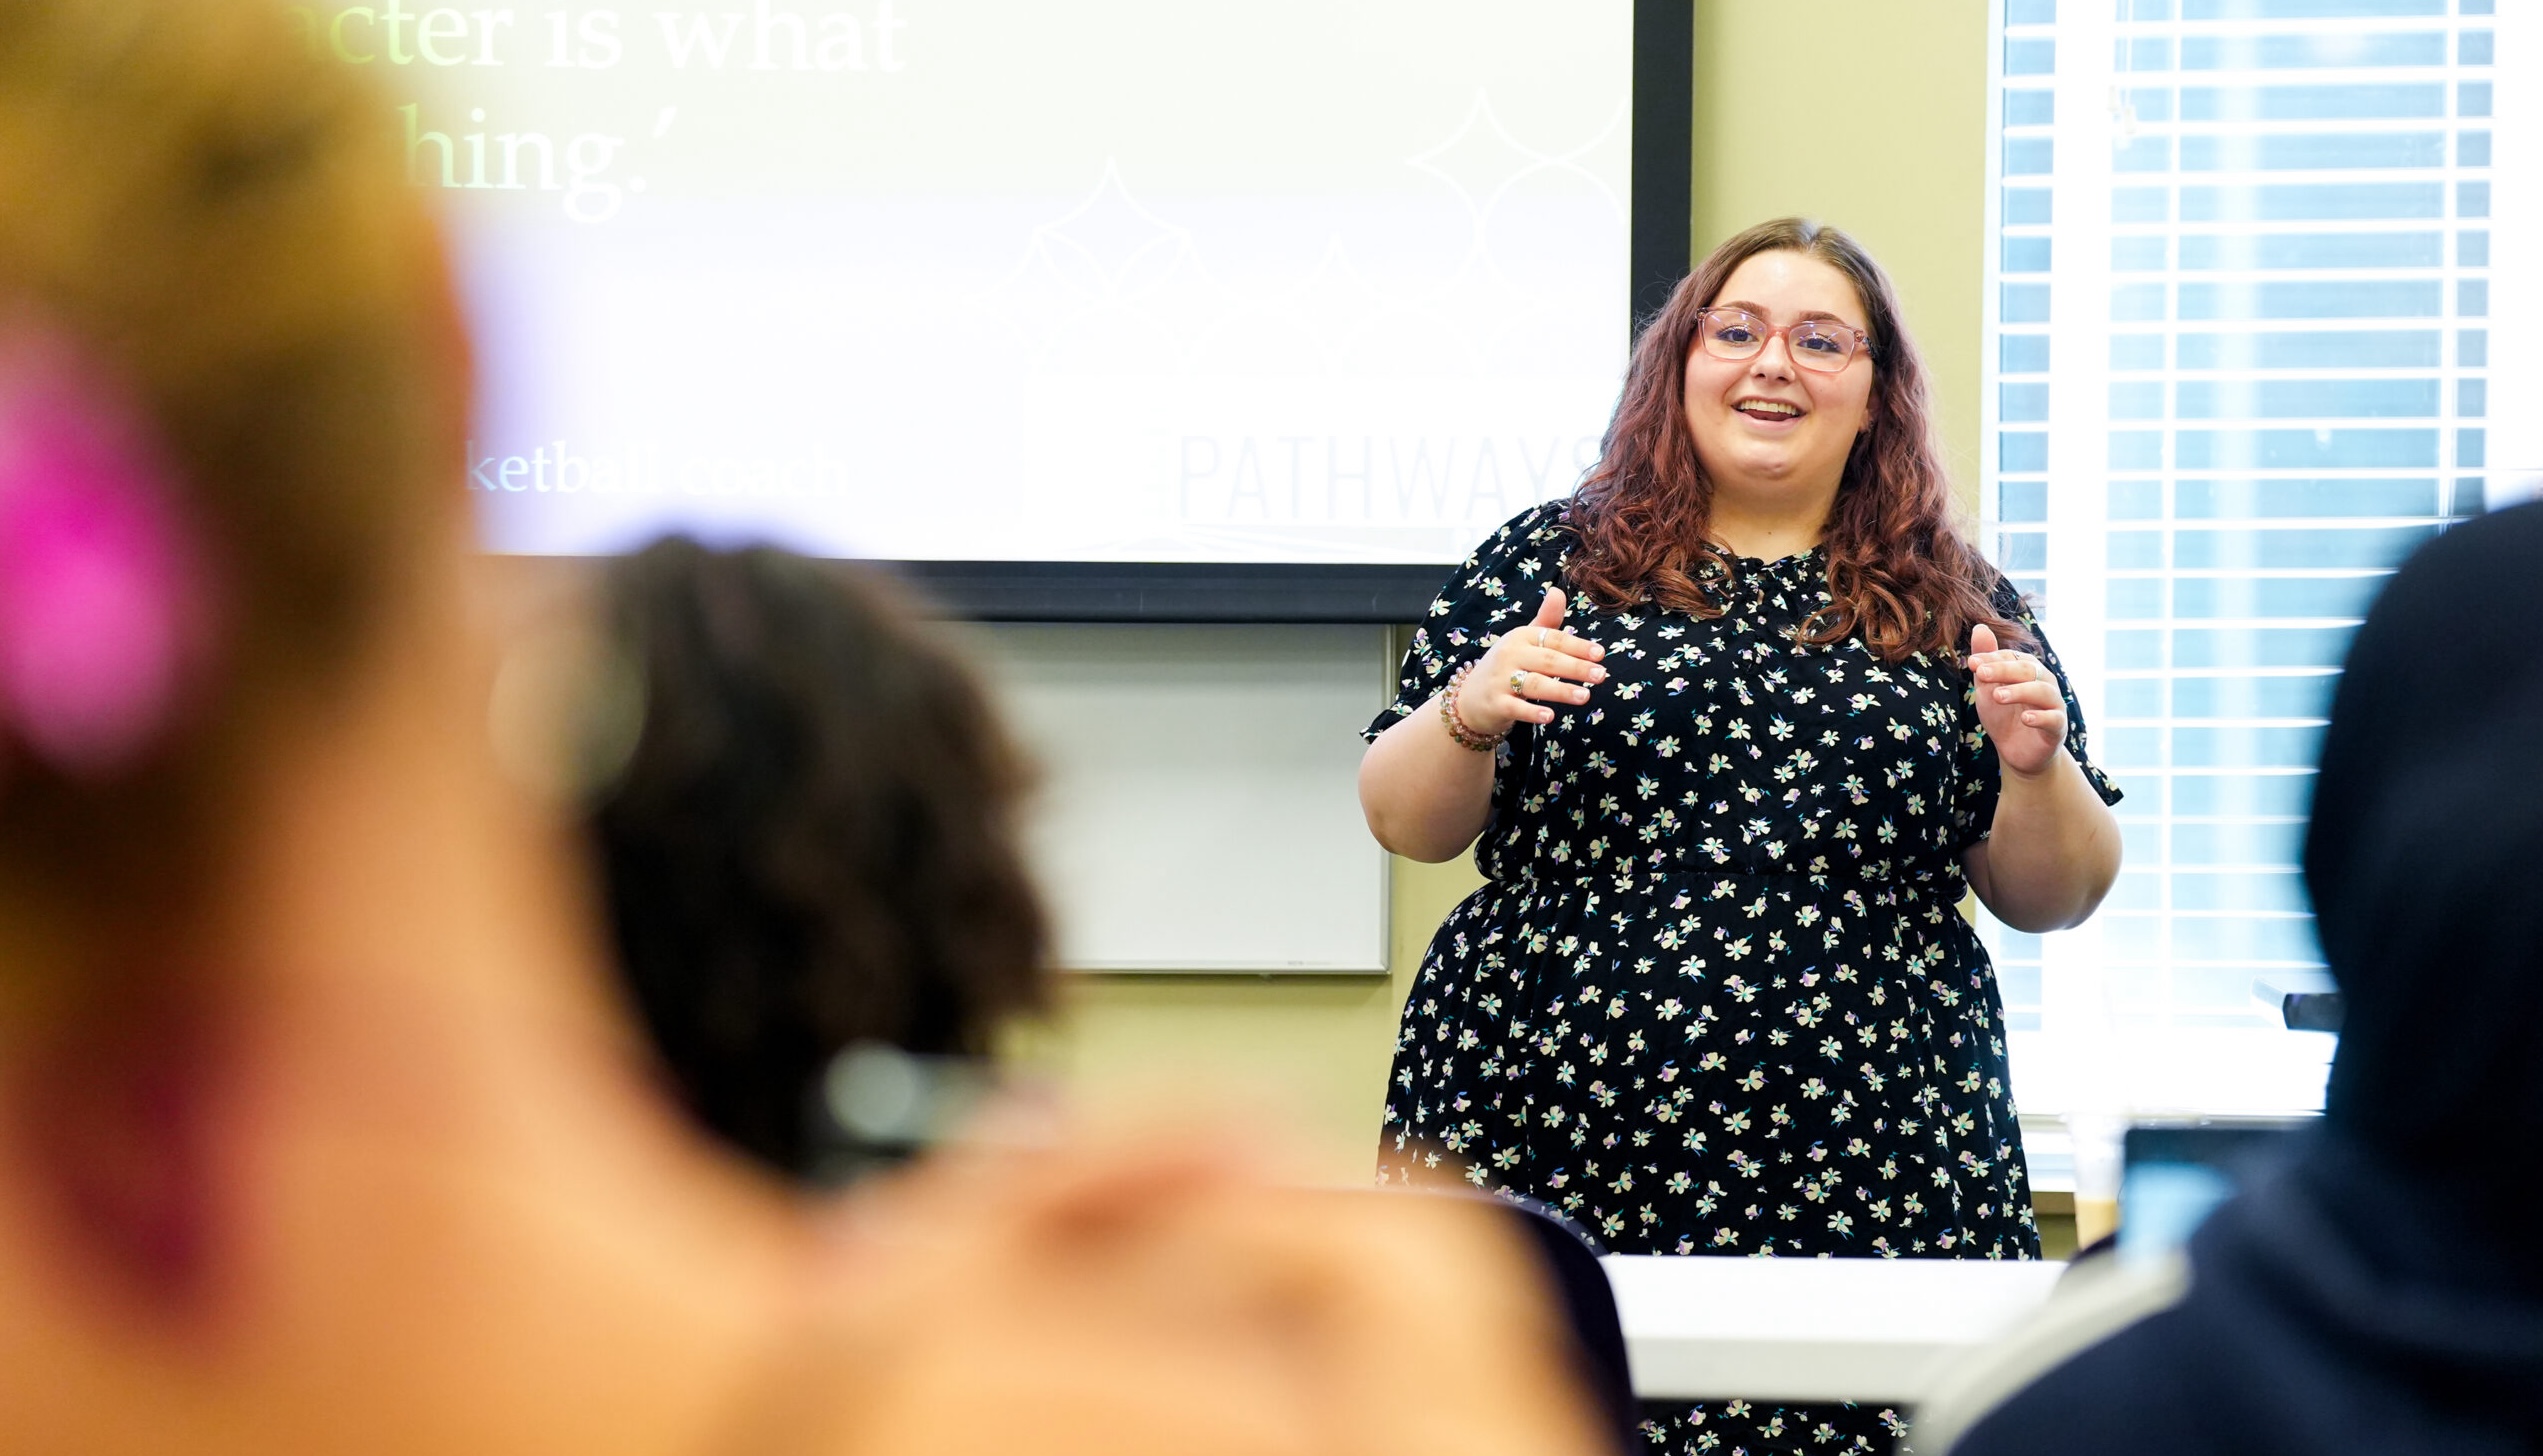
The Furman Advantage is further accentuated with the Pathways Program, our two-year, four-credit program for all first-year and sophomore students. Each semester of that first year, students attend Pathways classes and engage in individual meetings with their advisor and a peer mentor to focus on skills that will help them transition to college life as well as help them learn about their interests, their values and who they are. The sophomore year of Pathways encourages students to learn about their career goals and introduces them to programs that will help like study away, on- and off-campus research opportunities and internships with university partners and other companies, ensuring they take full advantage of all that Furman offers.

-
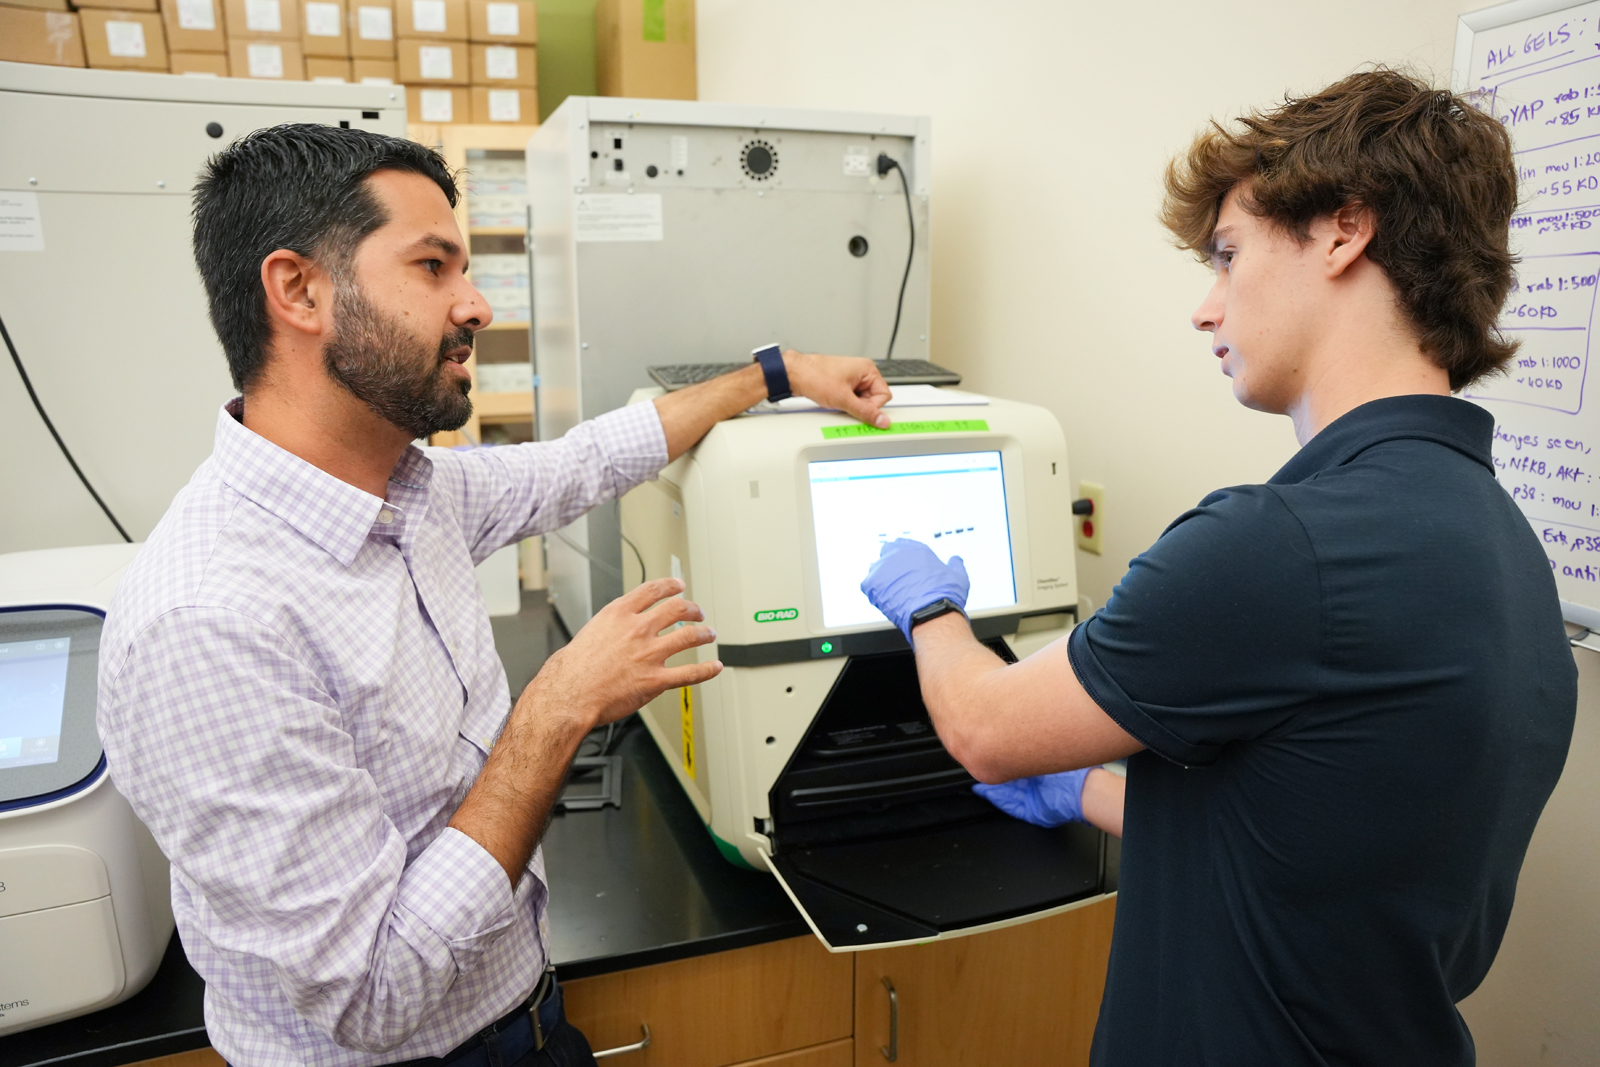
Furman chemists receive $1 million grant to create technology to better analyze air particles
The grant will fund the creation of a prototype of a portable, lightweight mass spectrometer that can be used to analyze potentially hazardous chemicals. -
Recent awards highlight Pathways programs successes
Furman has earned three awards recently recognizing the effectiveness of the advising and mentorship offered by The Furman Advantage and the two-year Pathways Program.
-
85%Percentage of students who participated in at least one high-impact learning practice
-
98%Placement rate six months after graduation(employed or in graduate school)
-
51%Graduates who participated in internships
-
44%Students who studied away this year
-
$18KTotal in stipends per year to undergraduates for internships and research
-
1,213Heller Service Corps volunteers

EMPLOYMENT BY INDUSTRY
-
20%Education, Human Services and Nonprofit
-
13%Other
-
12%Health Care
-
11%Business Development, Management and Consulting
-
11%Science, Research and Technology
-
9%Marketing, Sales and Consumer Products
-
9%Accounting, Finance and Banking
-
7%Government, Law and Public Service
-
6%Art, Media and Communication
-
3%Information Technology