Asset Allocation (as of January 31, 2026)
| Category | Actual Allocation | Target Allocation |
|---|---|---|
| Domestic Equity 15.0%-25.0% |
Actual Allocation
20.2%
|
Target Allocation
20.0%
|
| Non-U.S. Developed Equity 8.0%-18.0% |
Actual Allocation
15.3%
|
Target Allocation
16.0%
|
| Emerging Markets Equity 0.0%-10.0% |
Actual Allocation
5.8%
|
Target Allocation
5.0%
|
| Private Equity 15.0%-35.0% |
Actual Allocation
23.0%
|
Target Allocation
29.0%
|
| Total Flexible Capital 7.0%-17.0% |
Actual Allocation
18.5%
|
Target Allocation
15.0%
|
| Total Fixed Income 2.0%-12.0% |
Actual Allocation
3.7%
|
Target Allocation
4.0%
|
| Total Private Credit 0.0%-10.0% |
Actual Allocation
0.0%
|
Target Allocation
2.0%
|
| Total Real Assets 7.0%-17.0% |
Actual Allocation
6.5%
|
Target Allocation
6.0%
|
| Total Cash 0.0%-10.0% |
Actual Allocation
7.1%
|
Target Allocation
3.0%
|
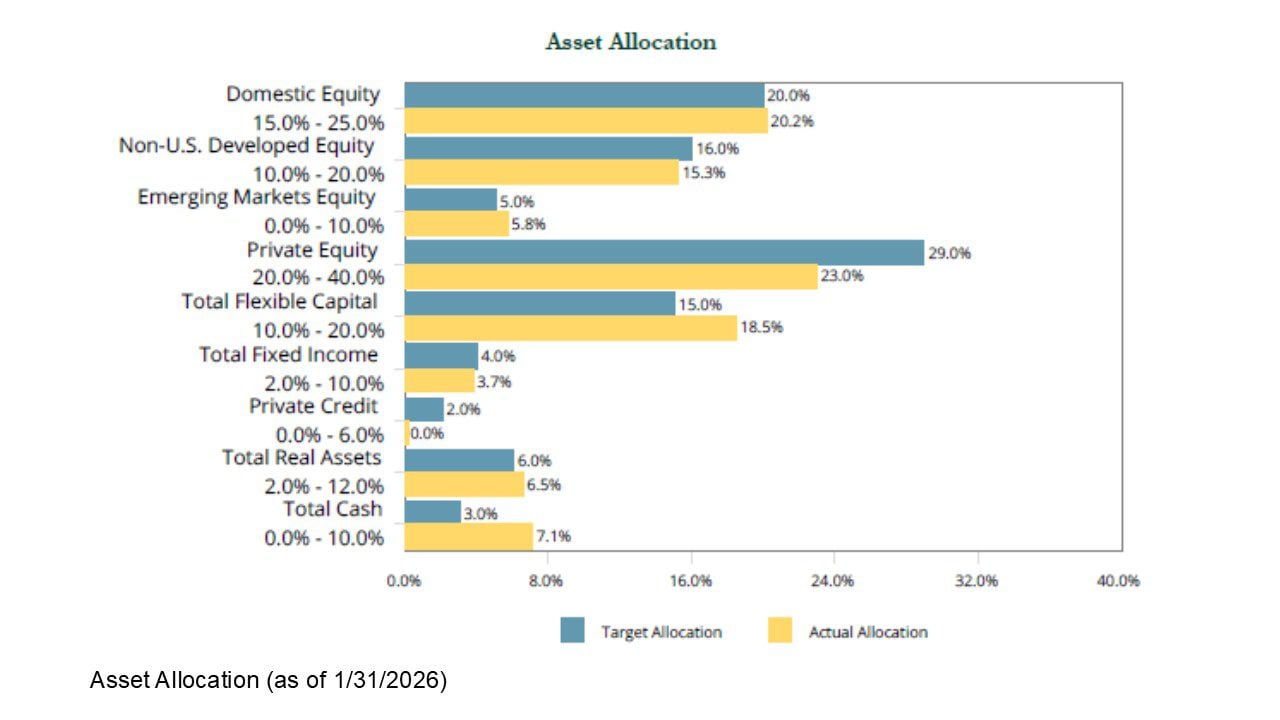
Asset Allocation Graph (as of January 31, 2026)
The Asset Allocation figures as seen in the graph to the right are stated above.
Endowment Pool Performance (as of January 31, 2026)
| 1-Year | 3-Years | 5-Years | 10-Years | 15-Years |
|---|---|---|---|---|
| 16.4% |
3-Years
11.1%
|
5-Years
9.7%
|
10-Years
9.2%
|
15-Years
8.0%
|