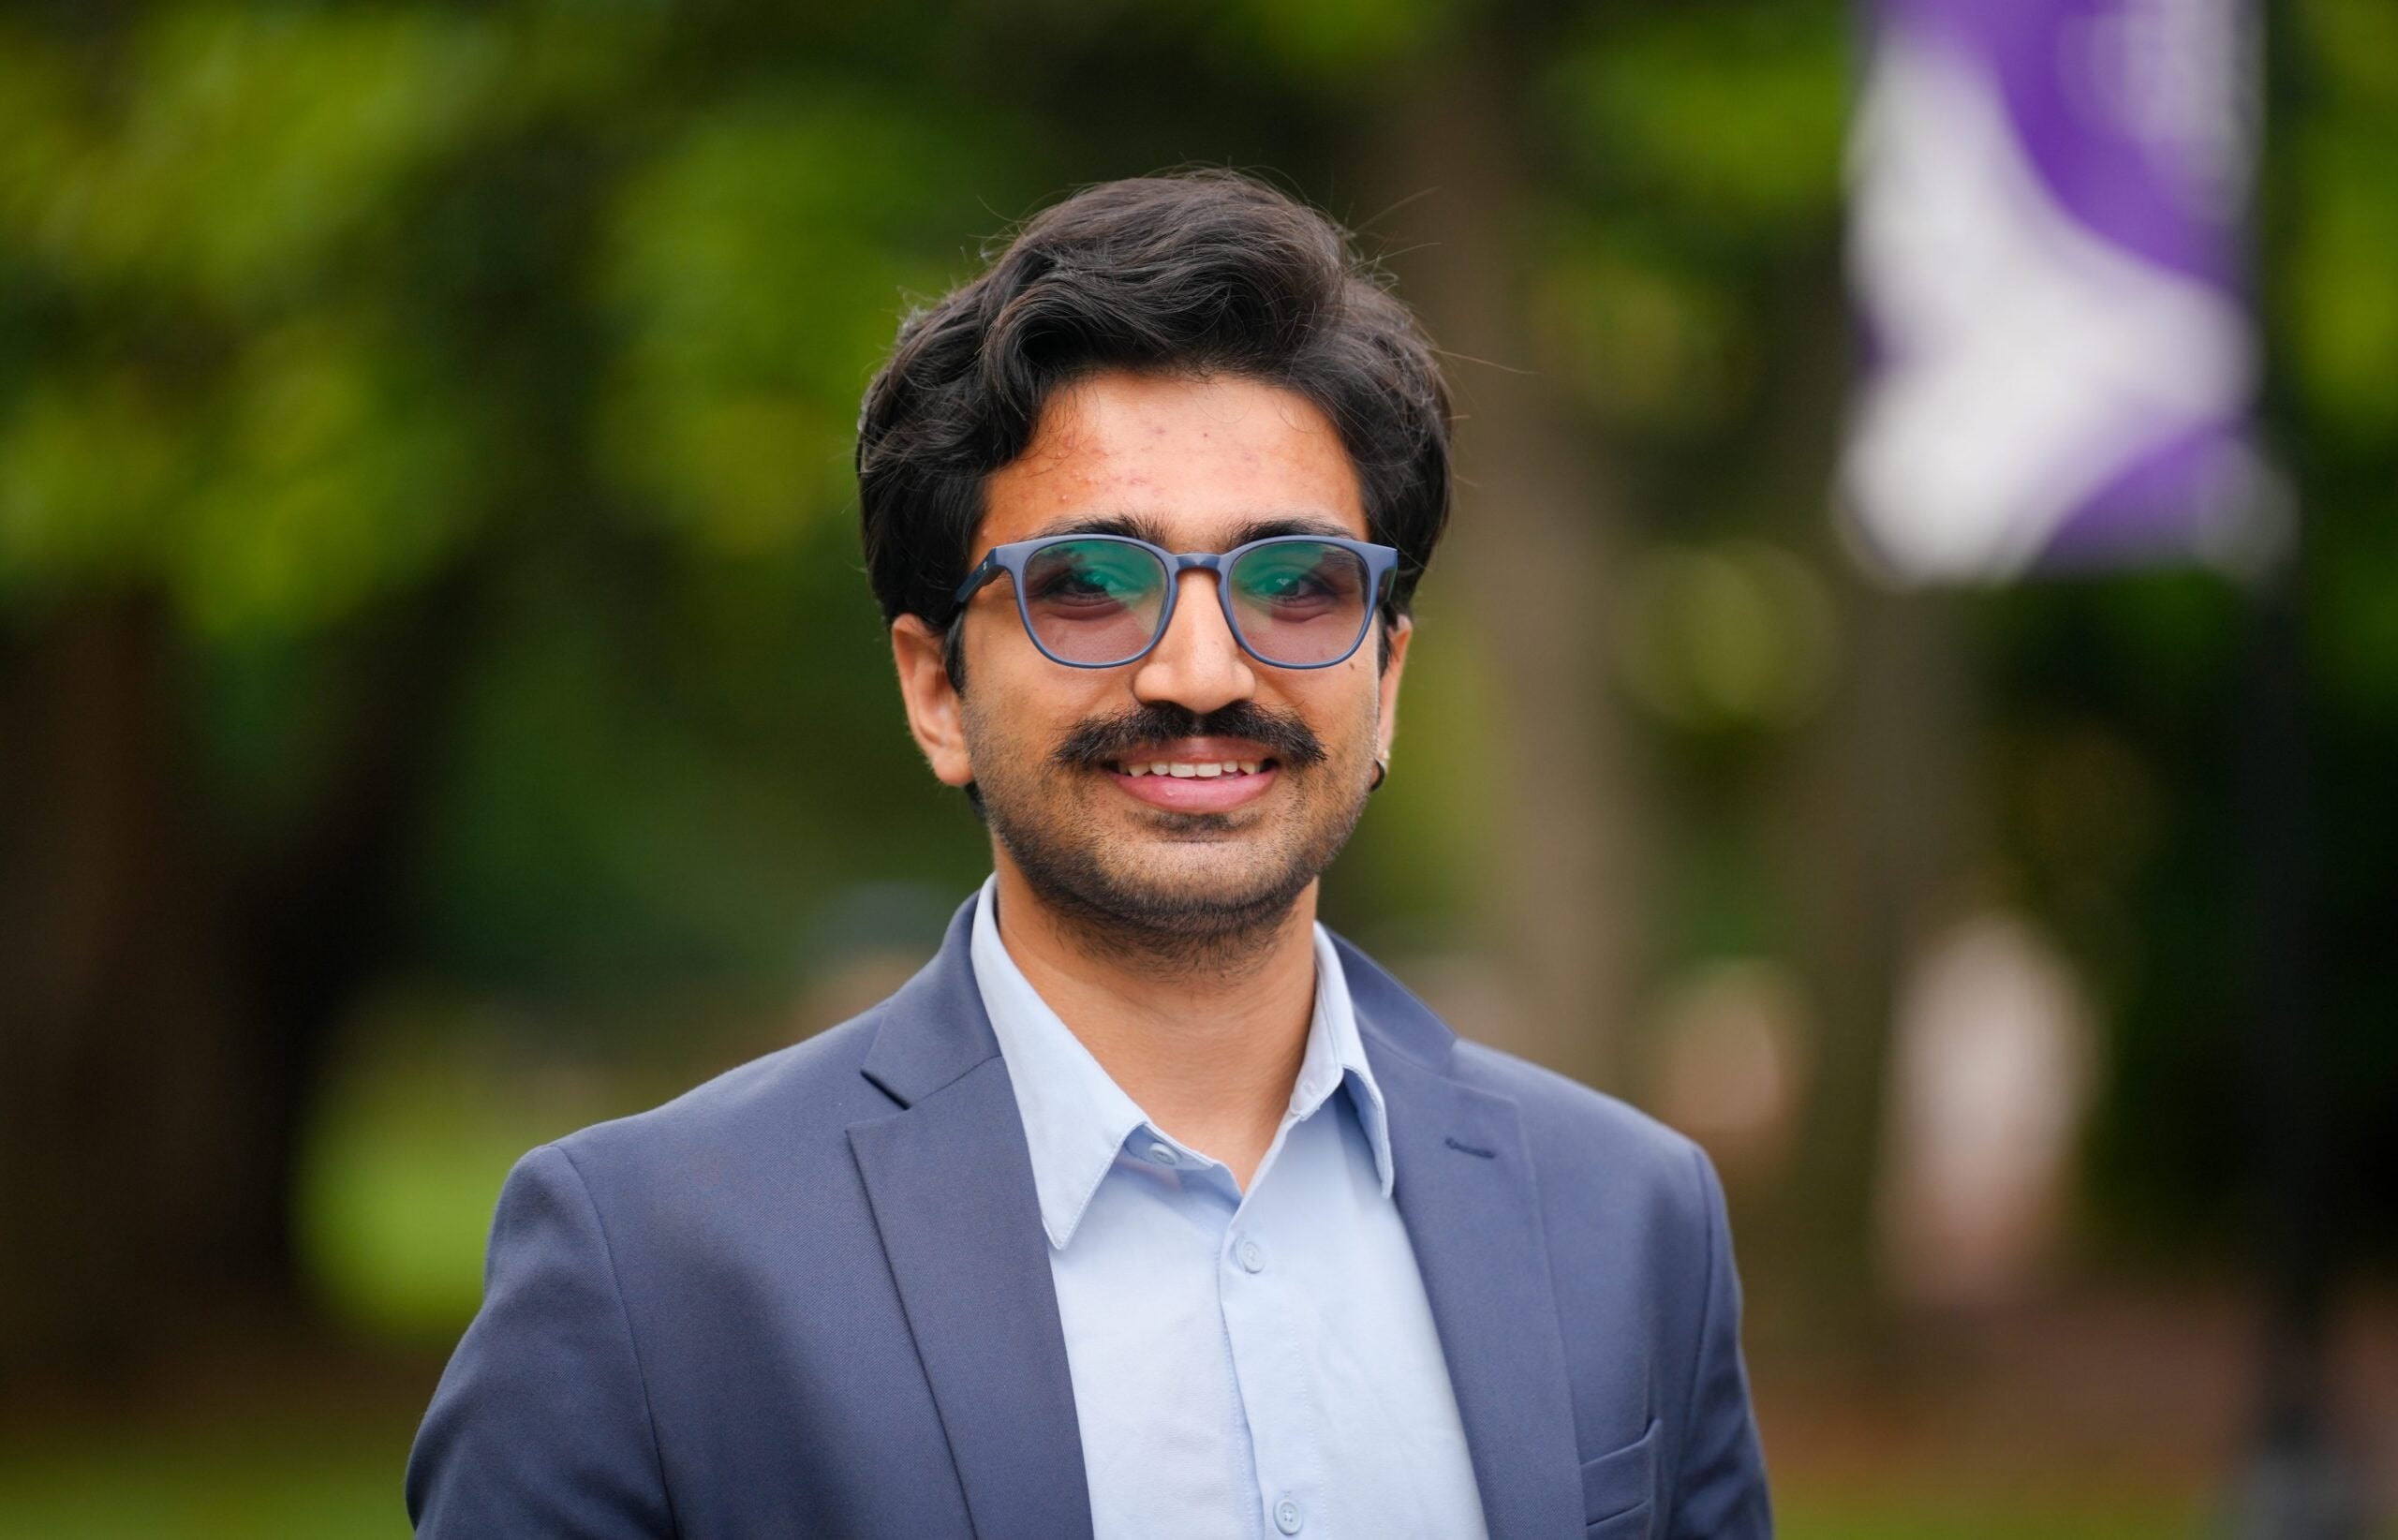
Saugat Pandey
Assistant Professor, Computer Science
- Email: saugatpandey02@gmail.com
- Office: RLY 200-A
Saugat Pandey is an Assistant Professor of Computer Science at Furman University, where he leads The Mocha Lab, a research group focused on data visualization, human perception, and artificial intelligence. He earned his PhD in Computer Science and Engineering from Washington University in St. Louis, where he worked as a graduate research assistant in the Visual Interface and Behavior Exploration (VIBE) Lab under the supervision of Dr. Alvitta Ottley.
Saugat's research asks a simple question with a lot of layers underneath: how do people actually read, trust, and reason with visual data, and how can AI systems help rather than get in the way? His work spans visualization literacy, trust in data visualization, and benchmarking large language and vision models on their ability to understand charts and graphs. His research has appeared in venues including ACM CHI, IEEE VIS, and EuroVIS, and his applied work on estimating air quality near public schools was published in Nature Scientific Reports. During the summer of 2025, he worked as a Research Scientist Intern at Adobe Research, focusing on the development of multi-agent systems designed to assist visualization practitioners in producing both effective and aesthetically pleasing visualizations. Furthermore, he worked as a Doctoral Student Intern at the American Institutes for Research during the summer of 2024, where he focused on developing dashboards and analyzing the mathematics performance of Grade 8 students using NAEP datasets.
Outside the lab, Saugat has a two speed personality: constantly moving, or planning the next way to move faster, higher, or further off the ground. He is an enthusiastic hiker and an even more enthusiastic for skydiving, on the theory that if you are going to fall for something, it might as well be gravity. If he is not in his office, there is a good chance you will find him on a trail somewhere or doing laps around Furman's Swan Lake, probably still thinking about a chart or research or teaching that will not leave him alone.
Saugat is always happy to talk research, teaching, or the best way to convince a nervous first-time skydiver to actually jump. Prospective students and collaborators interested in visualization, perception, or AI are welcome to reach out.
Honors and Awards
- 2025 — First Prize, COVID Information Commons Student Paper Challenge, organized by Columbia University
- 2023 — Best Paper Award, "Mini-VLAT: A Short and Effective Measure of Visualization Literacy," EuroVIS 2023 (Leipzig, Germany)
- 2021 — Conwell-Huffer Endowed Prize in Mathematics, Beloit College (outstanding senior mathematics or computer science student)
- 2020 — Walter S. Haven Physics/Astronomy Prize, Beloit College (outstanding summer research project)
Education
- Ph.D., Computer Science, Washington University in St. Louis
- M.S., Computer Science, Washington University in St. Louis
- B.S., Computer Science and Mathematics, Beloit College
Research Interests
My research sits at the intersection of data visualization, human perception and cognition, and artificial intelligence. I study how people read, interpret, and sometimes misread charts and graphs, and I develop standardized, psychometrically validated instrument, Mini-VLAT, to measure visualization literacy across diverse populations, cultures, and, increasingly, AI systems themselves. A parallel line of work investigates trust in data visualization: what makes a chart feel credible, how trust is built or eroded through repeated interactions, and how to measure trust as a multidimensional construct rather than a single score.
My work also examines the relationship between humans and AI in visual analytics. I benchmark multimodal large language models on the same literacy assessments used with human participants, asking whether - and how - AI systems "see" data differently than people do, and what that means for human-AI teaming in data-driven decision-making. This includes designing multi-agent systems that support people in creating, interpreting, and reasoning about visualizations, as well as studying how aesthetics and design choices shape comprehension, engagement, and trust.
I am equally committed to extending this research beyond the lab. I am also interested in projects that bring visualization and data science methods to underserved contexts: developing visualization tools and literacy assessments accessible to Blind and Low Vision (BLV) communities; supporting medical and genomic visualization for clinicians and researchers working with complex biomedical data; and applying interpolation and visual analytics methods to environmental and public health questions, such as estimating air quality exposure at schools and its relationship to student achievement.
Methodologically, I draw on psychometrics, crowdsourced and in-lab user studies, statistical analysis, and AI, and I have applied these methods in both academic and industry settings, including research internships at Adobe Research and the American Institutes for Research.
At Furman, I have research labe - the MOCHA Lab (https://themochalab.github.io/) - that unites these threads: measuring how humans and AI systems perceive, trust, and reason about visual information, and translating that understanding into more effective, trustworthy, and accessible visualization tools and practices.
Publications
- Pandey, S., & Ottley, A. (2025). Benchmarking Visual Language Models on Standardized Visualization Literacy Tests. Computer Graphics Forum (Proc. EuroVis 2025)
- McKinley, O., Pandey, S., & Ottley, A. (2025). Trustworthy by Design: The Viewer's Perspective on Trust in Data Visualization. Proceedings of the ACM CHI Conference on Human Factors in Computing Systems
- Solen, M., Pandey, S., Moosvi, F., Ottley, A., & Munzner, T. (2025). Visualization Literacy or Skillset? Beyond the Analogy to Textual Literacy. IEEE VIS Workshop on Visualization for Communication (VisComm)
- Carroll, R., Bailey, P., Pandey, S., McCalla, D., & Snyder, T. (2025). Estimating PM2.5 at North Carolina Public School Locations: A Comparative Study of Data Sources and Interpolation Methods. Nature Scientific Reports
- Crouser, R.J., Matoussi, S., Kung, L., Pandey, S., McKinley, O., & Ottley, A. (2024). Building and Eroding: Exogenous and Endogenous Factors that Influence Subjective Trust in Visualization. IEEE Visualization & Visual Analytics (VIS)
- Pandey, S., McKinley, O., Crouser, R.J., & Ottley, A. (2023). Do You Trust What You See? Toward a Multidimensional Measure of Trust in Visualization. IEEE Visualization and Visual Analytics (VIS)
- Pandey, S., & Ottley, A. (2023). Mini-VLAT: A Short and Effective Measure of Visualization Literacy. Computer Graphics Forum (Proc. EuroVis 2023) — Best Paper Award
- Kasumba, R., Pandey, S., Patel, V., Wolfson, M., & Ottley, A. (2023). User Engagement with COVID-19 Visualizations on Twitter. IEEE VIS Workshop on Visualization for Communication (VisComm)
0