

BY M. TAHA KASIM, Ph.D., KELSEY HAMPLE, Ph.D. & WALKER BURNS
Economics
_

_
The focus of our study is to understand the temporal changes in demographics in Greenville between 1940 and 1960, using economic data and trends to contextualize Furman University’s move outwards from downtown. For this purpose, we have collected historical data at the census tract level for Greenville County on certain demographics and economic indicators.

“The black population in the census tract where Furman University is currently located was less than 5% in 1960.”
_
Specifically, we have collected data on racial distribution within Greenville County from the 1960 Census. The data indicates that 45% of the population in downtown Greenville was black in 1960. The black population in the census tract where Furman University is currently located was less than 5% in 1960.
One economic reasoning for this could be the expected changes in the real estate and housing market.
“[B]etween 1940 and 1960 housing stock increased by 1.75% in downtown Greenville, whereas housing stock increased by 270% [where campus is now].”
_
Using Markley et al. (2022) urbanization data, we calculated the change in housing stock at the census tract level between 1940 and 1960 in Greenville County. For the census tracts mentioned above, housing stock increased by 1.75% in downtown Greenville, whereas housing stock increased by 270% in the census tract where Furman is currently located during this time period.
There are several studies that show that builders and landowners build before prices peak. That is, builders correctly and actively time the markets. A significant positive change in housing stock near Furman’s current location could be due to builders expecting prices to increase in this area (Baum-Snow and Han, 2024; Murphy, 2018; Paciorek, 2013).
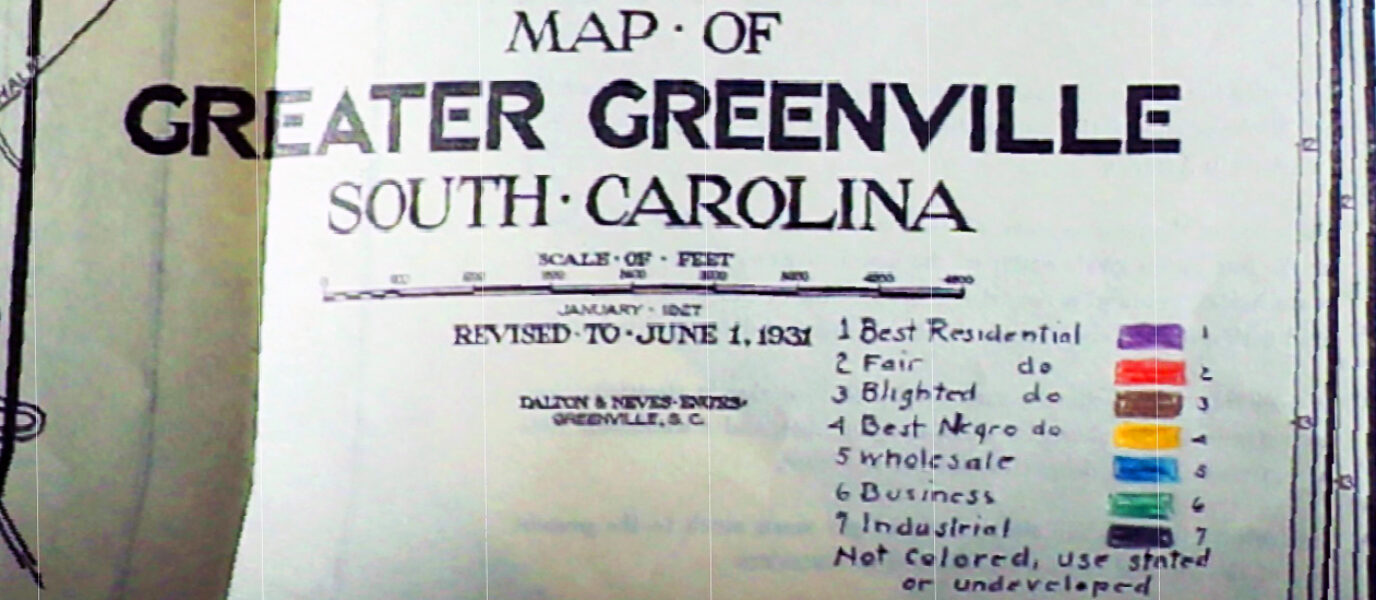
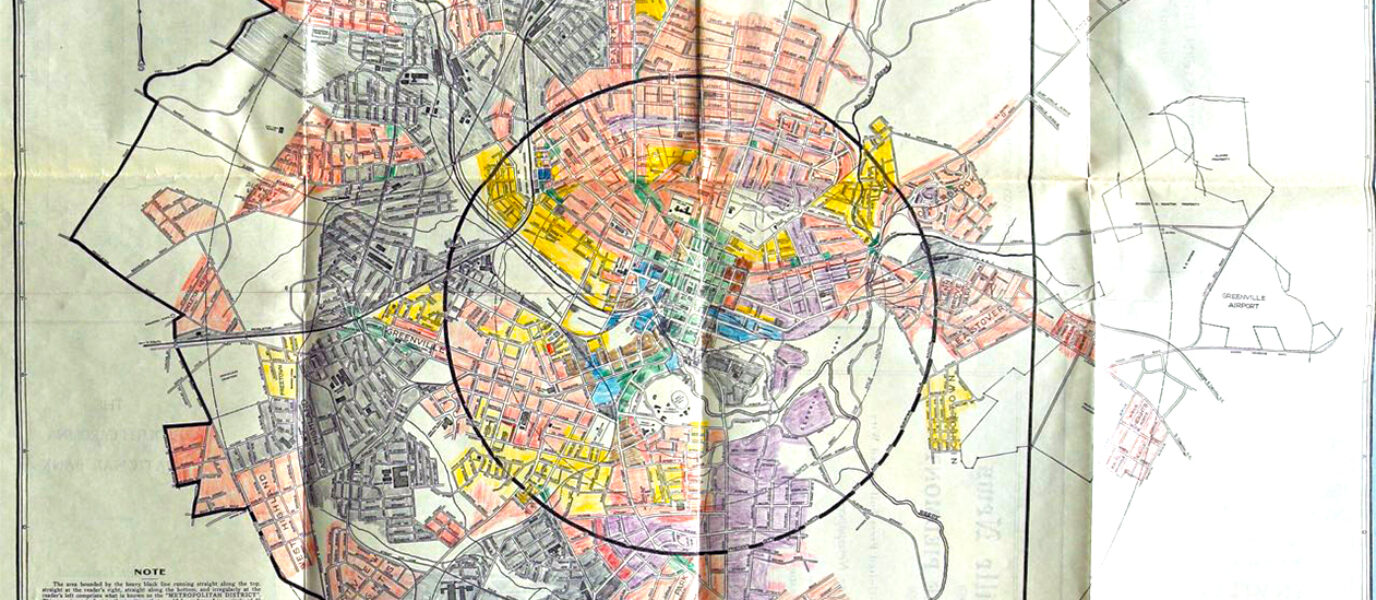
This is further supported by 1937 local appraisals of lending risk in Greenville, similar to the “redlining” maps of larger cities produced by the Homeowners’ Loan Corporation (HOLC). Because Greenville and other cities across the state were too small to merit their own official HOLC “redlining” maps, South Carolina state officials drew their own. In them, urban neighborhoods were graded on the perceived risk they posed to mortgage lenders and property investors.
The 1937 map below covers the downtown Greenville region. The data shows that Furman was originally located in a “blighted residential” and “best black residential” neighborhood.
Historical Context
_
Additionally, testimonial support from historical documents add context regarding the changing economic setting. In the 1940s, Furman faced downtown space constraints, inefficiencies of separate campuses for men and women, and a post-war influx of students.
The University and Greenville itself were interconnected, as Furman President Plyler acknowledged in a 1951 Greenville News article, “For the past century the growth, prosperity, and development of Furman and Greenville have been interwoven.”
“One important factor that could have contributed to demographic changes and Furman’s move revolves around the expansion of the highway infrastructure under the passage of the Federal Highway Act of 1956, specifically Poinsett Highway (US Highway 276).”
_
South Carolina Historic Resources Survey adds qualitative observations that shed light on Greenville County during and following the World War II era.
One important factor that could have contributed to demographic changes and Furman’s move revolves around the expansion of the highway infrastructure under the passage of the Federal Highway Act of 1956, specifically Poinsett Highway (US Highway 276).
The Greenville Historic Resources Survey notes, “In the late 1950s, the expansion of the federal highways supported further growth of textile mills and industrial plants in and around Greenville. […] the expansion of US Highway 276 created Interstate 385, known as the “Golden Strip”, which connected Greenville to Interstate 26. […] The city built new access roads to connect city streets with the new interstate system. […] Between the 1930s and 1980s, the downtown sector dropped from having over fifty percent of the county’s retail sales to less than three percent.” (WLA Studio, p. 30).
Furman’s move north coincided with the growth of a highway system that decentralized economic activity away from downtown.
Large lots of land, such as Furman’s Mill Village, changed hands as land value shifted significantly outwards from downtown.
According to the survey, “By 1947, the municipality of West Greenville struggled to support itself. […] Vast changes in the textile industry corresponded with selling the mill villages— within a twelve‐year period following World War II, ninety percent of mill houses in Greenville County were sold. In November 1948, West Greenville revoked its charter and merged with the City of Greenville. As the city expanded through the 1950s, the neighborhood became almost exclusively African American, and white homeowners left the neighborhood.” (WLA Studio, p. 38).
It is easy to understand why downtown demographics may have been shifting dynamically at this time and why demand for housing outside the then-dilapidated downtown increased significantly. It is also understandable that Furman trustees at the time, as well as builders searching for areas with increasing prices, realized that a college campus could fit into a booming suburban landscape.
_
_
ENDNOTES
_
Baum-Snow, N., & Han, L. (2024). The microgeography of housing supply. Journal of Political Economy, 132(6), 1897-1946.
Murphy, A. (2018). A dynamic model of housing supply. American economic journal: economic policy, 10(4), 243-267.
Markley, S. N., Holloway, S. R., Hafley, T. J., & Hauer, M. E. (2022). Housing unit and urbanization estimates for the continental US in consistent tract boundaries, 1940–2019. Scientific data, 9(1), 82.
Paciorek, A. (2013). Supply constraints and housing market dynamics. Journal of Urban Economics, 77, 11-26.
WLA Studio. (2018). City of Greenville Historic Resources Survey. Retrieved from https://scdah.sc.gov/sites/scdah/files/Documents/Historic%20Preservation%20(SHPO)/Research/Historic%20Contexts/GreenvilleCity2018.pdf
How Judson Mill's Gentrification Today is Connected to the RRCs in Its Past
by KEN KOLB, Ph.D.

